A website conversion audit is a structured review of analytics, technical performance, and page-level design that produces a prioritised, testable fix list rather than a lengthy report. We run these audits on client sites every week, and the ones that move revenue always end with a short list ranked by impact and effort. Most businesses can complete a useful quick-pass version in about four hours.
TL;DR:
- Focus on high-impact issues on your top conversion pages, as quick-pass audits often identify the majority of major fixes within four hours.
- Verify the accuracy of your analytics data through reconciliation with your sales records and ensure conversion events fire correctly before trusting metrics.
- Use session recordings and heatmaps to identify visitor behaviors like dead clicks, rage clicks, and scroll cliffs, which reveal why visitors drop off.
- Prioritize speed improvements that move Largest Contentful Paint and Cumulative Layout Shift, as these have the most influence on Core Web Vitals and real user experience.
- Convert audit findings into quick wins and test candidates by using impact versus effort scoring, shipping easy fixes immediately and hypothesizing for formal testing.
Table of Contents
- What is a website conversion audit and what should it produce?
- Is your analytics data actually trustworthy?
- What do heatmaps and session recordings actually reveal?
- Why field data matters more than lab scores for Core Web Vitals
- Does your page pass the five-second offer test?
- How do you turn audit findings into a testing roadmap?
- What tools do you actually need to run this audit?
- How Marketing Guardians runs continuous conversion audits
- Practical cautions before you trust your audit results
- Turn your audit findings into shipped fixes, not a shelved report
- Primary sources and further reading
- Sources
- FAQ
What is a website conversion audit and what should it produce?
A conversion audit combines quantitative evidence (analytics, benchmarks, speed data) with qualitative evidence (session recordings, heatmaps) to surface where visitors stall out. The output isn’t a 40-page PDF nobody reads. It’s a ranked list of specific fixes, each one tied to a hypothesis you can test.
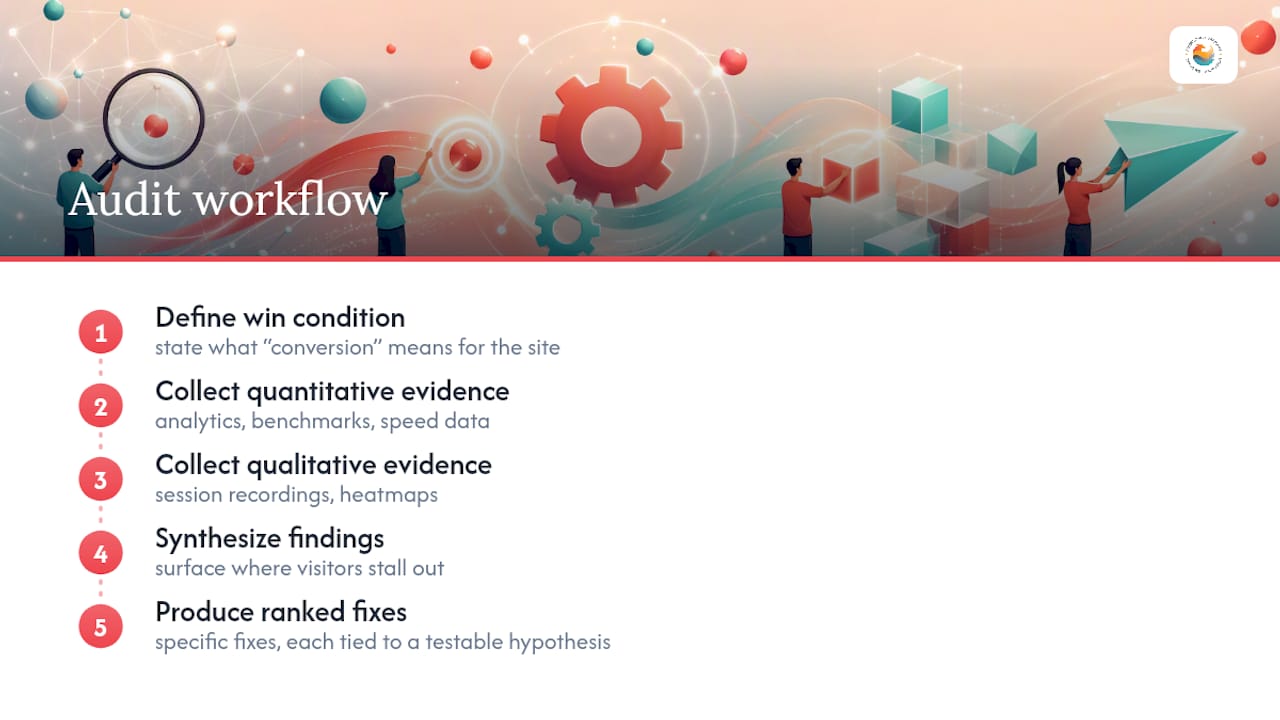
We tell every client the same thing before they start: define your win condition first. If you don’t know what “conversion” means for your site, every other step wastes time.
The quick-pass audit (about 4 hours)
- Define the single conversion that matters. Pick one: purchase, lead form, demo booking. Resist the urge to track five things at once.
- Pull 90 days of baseline data, split by device and traffic source, to find where the biggest drop-off happens. Segmenting first is what separates a useful audit from a guessing exercise, according to common CRO audit workflows.
- Run a speed check on your top three pages using PageSpeed Insights. Screenshot the scores.
- Watch 15 to 20 session recordings on the highest-traffic conversion page. Note every dead click, rage click, and scroll cliff.
- Manually review the page against a heuristic checklist (headline clarity, CTA visibility, trust signals, form friction).
- Build the fix list, scored by impact and effort, with a testable hypothesis attached to each item.
A tightly scoped audit on one critical funnel page often surfaces the majority of the highest-value quick fixes, since agencies typically expand scope and stretch timelines only because they’re auditing many pages and building longer testing roadmaps, not because a single-page review is incomplete.
The full audit (multi-day, multi-page)
Scale the same six steps across your entire funnel: homepage, category or service pages, product or landing pages, and cart or checkout. Baymard Institute’s conversion audit framework recommends walking the customer journey page by page precisely because friction compounds. A confusing category page bleeds traffic before visitors even reach your product page.
For each page in the full audit, capture:
- The primary and secondary conversion goal for that page
- Baseline conversion rate, bounce rate, and average time on page
- A screen recording or annotated screenshot of any friction point
- A Core Web Vitals score (see the technical section below)
- A one-line hypothesis for the top issue found
Hand this off as a spreadsheet, not a narrative document. Developers and stakeholders act faster on a table with columns for “issue,” “evidence,” “proposed fix,” and “score” than on paragraphs describing the same thing. If you’re auditing pages built specifically for paid traffic, know that dedicated landing pages typically convert roughly twice as well as generic homepages built for broad audiences, so weight those pages heavily if you’re running ads. Our landing page development work leans on exactly this principle.
Is your analytics data actually trustworthy?
Before you trust a single number in your baseline, verify that GA4 is counting things correctly. This step gets skipped constantly, and it’s the reason audits based on bad data recommend the wrong fixes.
Start with these checks:
- Confirm your conversion events fire once per action, not once per page load or once per click-and-reload sequence.
- Check your ecommerce schema if you sell products: item IDs, values, and currency should match your product catalogue exactly.
- Review attribution windows in GA4’s settings. A default 30-day click window can overcredit paid channels for conversions that organic search actually drove.
- Look for duplicate Google Tag Manager tags firing the same event twice. This is one of the most common GA4 audit pitfalls, and it inflates your conversion count without anyone noticing for months.
The real test of data integrity is reconciliation. Pull your GA4 conversion count for a fixed period and compare it against your CRM or backend sales records for that same window. If GA4 shows more conversions than your sales system does, you likely have duplicate events or a tracking configuration issue, not a sudden surge in real sales.
Pro Tip: Run this reconciliation check monthly, not just during audits. A tag that starts double-firing after a website update can quietly inflate your numbers for weeks before anyone notices the mismatch.
If your business collects personal data through forms or cookies, fold a consent check into this step too. The Office of the Privacy Commissioner of Canada’s guidance on meaningful consent recommends periodically auditing your privacy communications and data practices, and this is the natural moment to do it since you’re already inside your tag manager and analytics settings.
What do heatmaps and session recordings actually reveal?
Numbers tell you where visitors drop off. Recordings tell you why. Watching 15 to 20 sessions on your highest-traffic conversion page will surface patterns faster than staring at a funnel report.
Sample deliberately rather than randomly:
- Filter recordings to sessions that reached the page but did not convert. These are your friction cases.
- Watch a smaller batch (5 to 10) of sessions that DID convert, to see what a smooth path looks like by contrast.
- Segment by device. Mobile friction almost never looks like desktop friction, and watching both mixed together muddies your notes.
While watching, log three specific behaviours:
- Dead clicks: visitors clicking something that isn’t actually clickable (a bolded phrase, a static image they expect to be a button).
- Rage clicks: rapid repeated clicks on the same element, usually a sign a form field or button appears broken.
- Scroll cliffs: the exact scroll depth where most visitors stop reading or scrolling, which often points to a headline or offer that failed to hold attention.
Heatmap tools like Microsoft Clarity aggregate these signals across hundreds of sessions, which is useful once you’ve confirmed by eye that the individual recordings match what the heatmap suggests.
Pair the recordings with a short on-site survey triggered on exit intent or after a delay. Keep it to one question: “What almost stopped you from completing this today?” or “What information were you looking for that you couldn’t find?” Open-ended, single-question surveys get answered more often than multi-question forms, and the answers map directly onto hypotheses you can test.
Why field data matters more than lab scores for Core Web Vitals
Google measures Core Web Vitals two different ways, and confusing them leads to wasted effort. Lighthouse and PageSpeed Insights give you lab data, a controlled test run on Google’s servers. The Chrome User Experience Report (CrUX) gives you field data, real measurements from actual visitors’ browsers, aggregated at the 75th percentile over a rolling 28-day window.
Field data should drive your priority list. Lab tools help you debug a specific issue, but they don’t reflect what Google actually uses as a ranking signal, and they can look fine while real users on slower connections are still struggling.
Because CrUX aggregates over 28 days, a fix you ship today won’t fully show up in your field data for about four weeks. Budget your reporting timeline accordingly. If you tell a stakeholder “conversions will jump next week” after a speed fix, you’re setting up a disappointing check-in.
Fix Core Web Vitals in this order:
- Largest Contentful Paint (LCP) first. This is the single biggest lever, since it measures how fast your main content becomes visible.
- Cumulative Layout Shift (CLS) second. Fixing unexpected layout jumps is usually cheap and fast.
- Interaction to Next Paint (INP) third, since it typically requires deeper JavaScript work.
Quick wins that move LCP and CLS without a developer sprint:
- Preload your hero image or LCP element in the page head
- Defer or async non-critical JavaScript
- Set explicit width and height attributes on every image
- Cut third-party scripts you can’t justify (old chat widgets, unused pixel tags)
Site speed and conversion rate are tightly linked, and faster load times consistently correlate with better SEO and conversion outcomes across the sites that have been studied.
Does your page pass the five-second offer test?
Hand your homepage or landing page to someone unfamiliar with your business and give them five seconds. If they can’t tell you what you sell, who it’s for, and what to do next, your offer isn’t clear enough to convert.
Run this checklist page by page, mobile first:
- Headline clarity: does it state a specific outcome, not a vague slogan?
- CTA visibility: is the primary action visible without scrolling on mobile, and does the button text describe the actual next step (“Start My Free Trial” beats “Submit”)?
- Proof and trust: are reviews, guarantees, or third-party badges visible near the decision point, not buried in a footer?
- Price and shipping transparency: is the total cost clear before checkout, with no surprise fees appearing at the last step?
- Form field count: does every field on the form earn its place, or are you asking for information you don’t actually need yet?
- Progressive disclosure: for longer forms, are you breaking the process into steps rather than one long scroll?
- Error messaging: do form errors point to the specific field and explain the fix, instead of a generic “something went wrong”?
Pro Tip: Test your checkout error messages yourself by deliberately entering a wrong postal code or expired card. If the error message doesn’t tell you exactly what to fix, your customers are hitting that same wall blind.
Baymard’s e-commerce research backs this page-by-page approach: walking the customer journey from homepage through checkout catches friction that a single funnel-wide metric would never isolate. For deeper tactical guidance on tightening this kind of persuasive copy, our piece on converting website traffic into sales covers specific wording patterns that reduce hesitation at the CTA.
How do you turn audit findings into a testing roadmap?
Every fix you found needs a score before it earns a spot on your roadmap. The impact-versus-effort model, sometimes called ICE (Impact, Confidence, Ease) or PIE (Potential, Importance, Ease), forces you to separate the fixes worth doing immediately from the ones worth testing formally.
| Quadrant | Impact | Effort | Action |
|---|---|---|---|
| Quick win | High | Low | Ship immediately, no test needed |
| Test candidate | High | High | Write a hypothesis, run an A/B test |
| Backlog | Low | Low | Batch with other small fixes |
| Skip | Low | High | Drop unless a stakeholder insists |
For anything landing in the “test candidate” quadrant, write the hypothesis in one sentence: “Because [evidence from the audit], we believe [specific change] will [specific outcome], measured by [metric].” A hypothesis without evidence attached is just a guess dressed up in a template.
To sequence your roadmap:
- Ship every quick win in the first week, before you touch anything else.
- Launch your highest-confidence test candidate next, so you get a learning fast.
- Batch backlog items into a single sprint rather than shipping them one at a time.
If your traffic is low, formal A/B tests may not reach statistical significance in a reasonable timeframe. Lean harder on heuristic fixes and qualitative evidence instead of waiting on a test that will never resolve.
What tools do you actually need to run this audit?
You can run a genuinely useful audit without spending a cent on software. The free stack covers most of what a small or mid-sized site needs:
- GA4: baseline metrics, conversion events, segmentation by device and source
- Microsoft Clarity: heatmaps and free session recordings
- PageSpeed Insights: lab performance scores and specific fix recommendations
- Search Console: field-level Core Web Vitals data and crawl issues
Paid tools earn their cost once your traffic or complexity grows past what free tools handle well. A dedicated heatmap and survey platform adds value when you need to run on-site surveys at scale or segment recordings by more granular criteria than Clarity offers. A form-analytics tool pays off once you’re running checkout flows with multiple steps and need field-by-field abandonment data.
| Audit area | Tool | What it delivers |
|---|---|---|
| Analytics baseline | GA4 | Conversion events, segmentation, funnel drop-off |
| Behaviour | Microsoft Clarity | Heatmaps, session recordings, rage-click flags |
| Speed | PageSpeed Insights | Lab scores, prioritised fix list |
| Field performance | Search Console | Core Web Vitals by URL, 28-day trend |
| Consent and privacy | Manual review against OPC guidelines | Compliance gaps in cookie banners and consent records |
Keep a one-page checklist grouped by these five areas and reuse it every quarter. Consistency across audits is what lets you spot trends instead of chasing a different fire every time.
How Marketing Guardians runs continuous conversion audits
We built our subscription model around the idea that a one-time audit goes stale the moment your site changes. Marketing Guardians runs recurring conversion audits for clients as part of an ongoing plan, pairing the analytics and technical checks above with implementation sprints so the fixes actually ship instead of sitting in a spreadsheet.
The businesses that see the biggest lifts aren’t the ones who ran one perfect audit. They’re the ones who treated the audit as a recurring habit tied to a live fix list, not a one-time report that gathers dust after the first meeting.
Our case study work, including the PALC engagement, shows how repeated rounds of testing compound over time rather than delivering one dramatic spike. A subscription structure means the audit, the fix, and the next round of testing happen on a continuous cycle instead of a single disconnected engagement. That’s also why our digital marketing metrics guide exists as a companion resource: audits only work if you’re tracking the right numbers between them.
Practical cautions before you trust your audit results
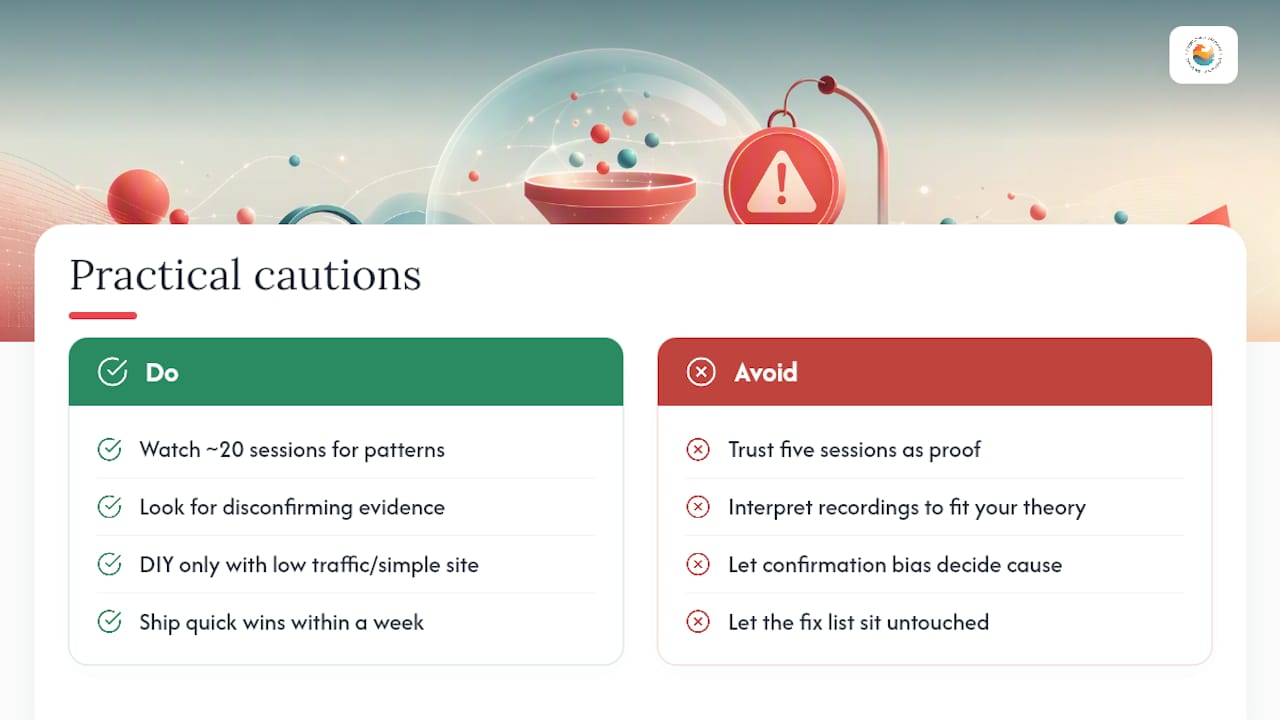
The biggest mistake we see is treating a small sample of session recordings as gospel. Watch 20 sessions and you’ll find a pattern; watch five and you’ll find a coincidence. Confirmation bias is the second trap: once you’re convinced your CTA button is the problem, you’ll interpret every recording to support that theory.
A DIY audit is genuinely enough if your traffic is low, your site is simple, and you’re comfortable acting on directional evidence rather than statistical proof. Bring in ongoing help once you’re running multiple concurrent tests, reconciling analytics across several channels, or your fix list keeps outpacing your team’s capacity to ship it. Immediately after any audit, ship the quick wins within the week. Momentum dies fast once a fix list sits untouched.
— Stephen Ramkissoon
Turn your audit findings into shipped fixes, not a shelved report
Most businesses run a solid audit and then stall at implementation because nobody owns the fix list. Marketing Guardians closes that gap: our subscription plans build the audit, the prioritised roadmap, and the actual implementation sprints into one ongoing service, so your quick wins ship in days instead of sitting in a backlog behind other priorities.

A subscription with us typically covers recurring conversion audits, hands-on implementation of the fixes we find, and regular reporting that ties changes back to real conversion movement, not vanity metrics. Before you reach out, gather your last 90 days of GA4 data, admin access to your site, and a list of your top three conversion goals. From there, our conversion optimization service picks up the rest. If paid traffic feeds your funnel, pairing this with our Google Ads management ensures the pages your ads point to are the pages we’ve actually audited. Reach out through our Alberta SMB marketing services guide to start a conversation about what a recurring audit plan looks like for your site.
Primary sources and further reading
- OPC guidance on meaningful consent
- Core Web Vitals and SEO guidance
- Baymard’s conversion audit framework
Sources
- How to Do a CRO Audit: A Step-by-Step Guide (Without the $5k Agency)
- What Is a Conversion Audit? Crucial Data for E-Commerce CRO
- Guidelines for obtaining meaningful consent (Office of the Privacy Commissioner of Canada)
FAQ
Is a 12% conversion rate on a website good?
It depends heavily on industry and traffic source, but 12% is well above the typical ecommerce average and strong for most lead-generation sites. Compare your rate against your own historical baseline and segment by traffic source before assuming it’s good or bad in isolation.
What should be included in a website audit?
A complete conversion audit covers analytics and tracking validation, technical performance and Core Web Vitals, qualitative research from recordings and heatmaps, and a page-by-page heuristic review of copy, CTAs, and forms. Each area should end with specific, prioritised fixes rather than general observations.
How do you check the conversion rate of a website?
Set up a defined conversion event in GA4, then divide total conversions by total sessions for the period you’re measuring, splitting the result by device and traffic source. Reconcile that number against your CRM or sales records to confirm the analytics count is accurate before trusting it.
Can you do your own SEO or conversion audit?
Yes, a DIY audit using the free stack of GA4, Microsoft Clarity, PageSpeed Insights, and Search Console covers most of what a quick-pass audit needs. Bring in ongoing help once your fix list outpaces your team’s ability to implement it or you need statistically sound A/B testing at scale.
Recommended

AI search is changing fast. Download our Playbook to make sure you keep up.
Inside our AI Search and GEO Playbook, you’ll find a readiness checklist and a few copy-and-paste building blocks:
- Add Organization, Person, and Service schema to your About and Services pages.
- Add a short FAQ to your top service page with two or three real customer questions.
Small changes like these help AI systems understand who you are, what you do, and when to reference you.
Where to start if you feel behind? Just begin with one page - one question - one clear answer. Then open the Playbook and pick the next small step. Consistency beats intensity here. Your future self will be glad you started this month.


